Multicore debugging challenges in Zephyr RTOS: Part 2 – Cache coherency
This second installment focuses on how to detect cache coherency issues, which are another common problem in multicore systems with multiple cores that must play well together. Before we dive in, let’s first review how caches can be organized in a multicore system. The diagram below shows how cache memory in a quad-core system is typically divided into L1, L2, and L3.
By Bea Ben Ali
Introduction
In part 1 of our three-part blog series, we discussed how to debug and analyze race conditions.
This second installment focuses on how to detect cache coherency issues, which are another common problem in multicore systems with multiple cores that must play well together.
Before we dive in, let’s first review how caches can be organized in a multicore system.
The diagram below shows how cache memory in a quad-core system is typically divided into L1, L2, and L3.
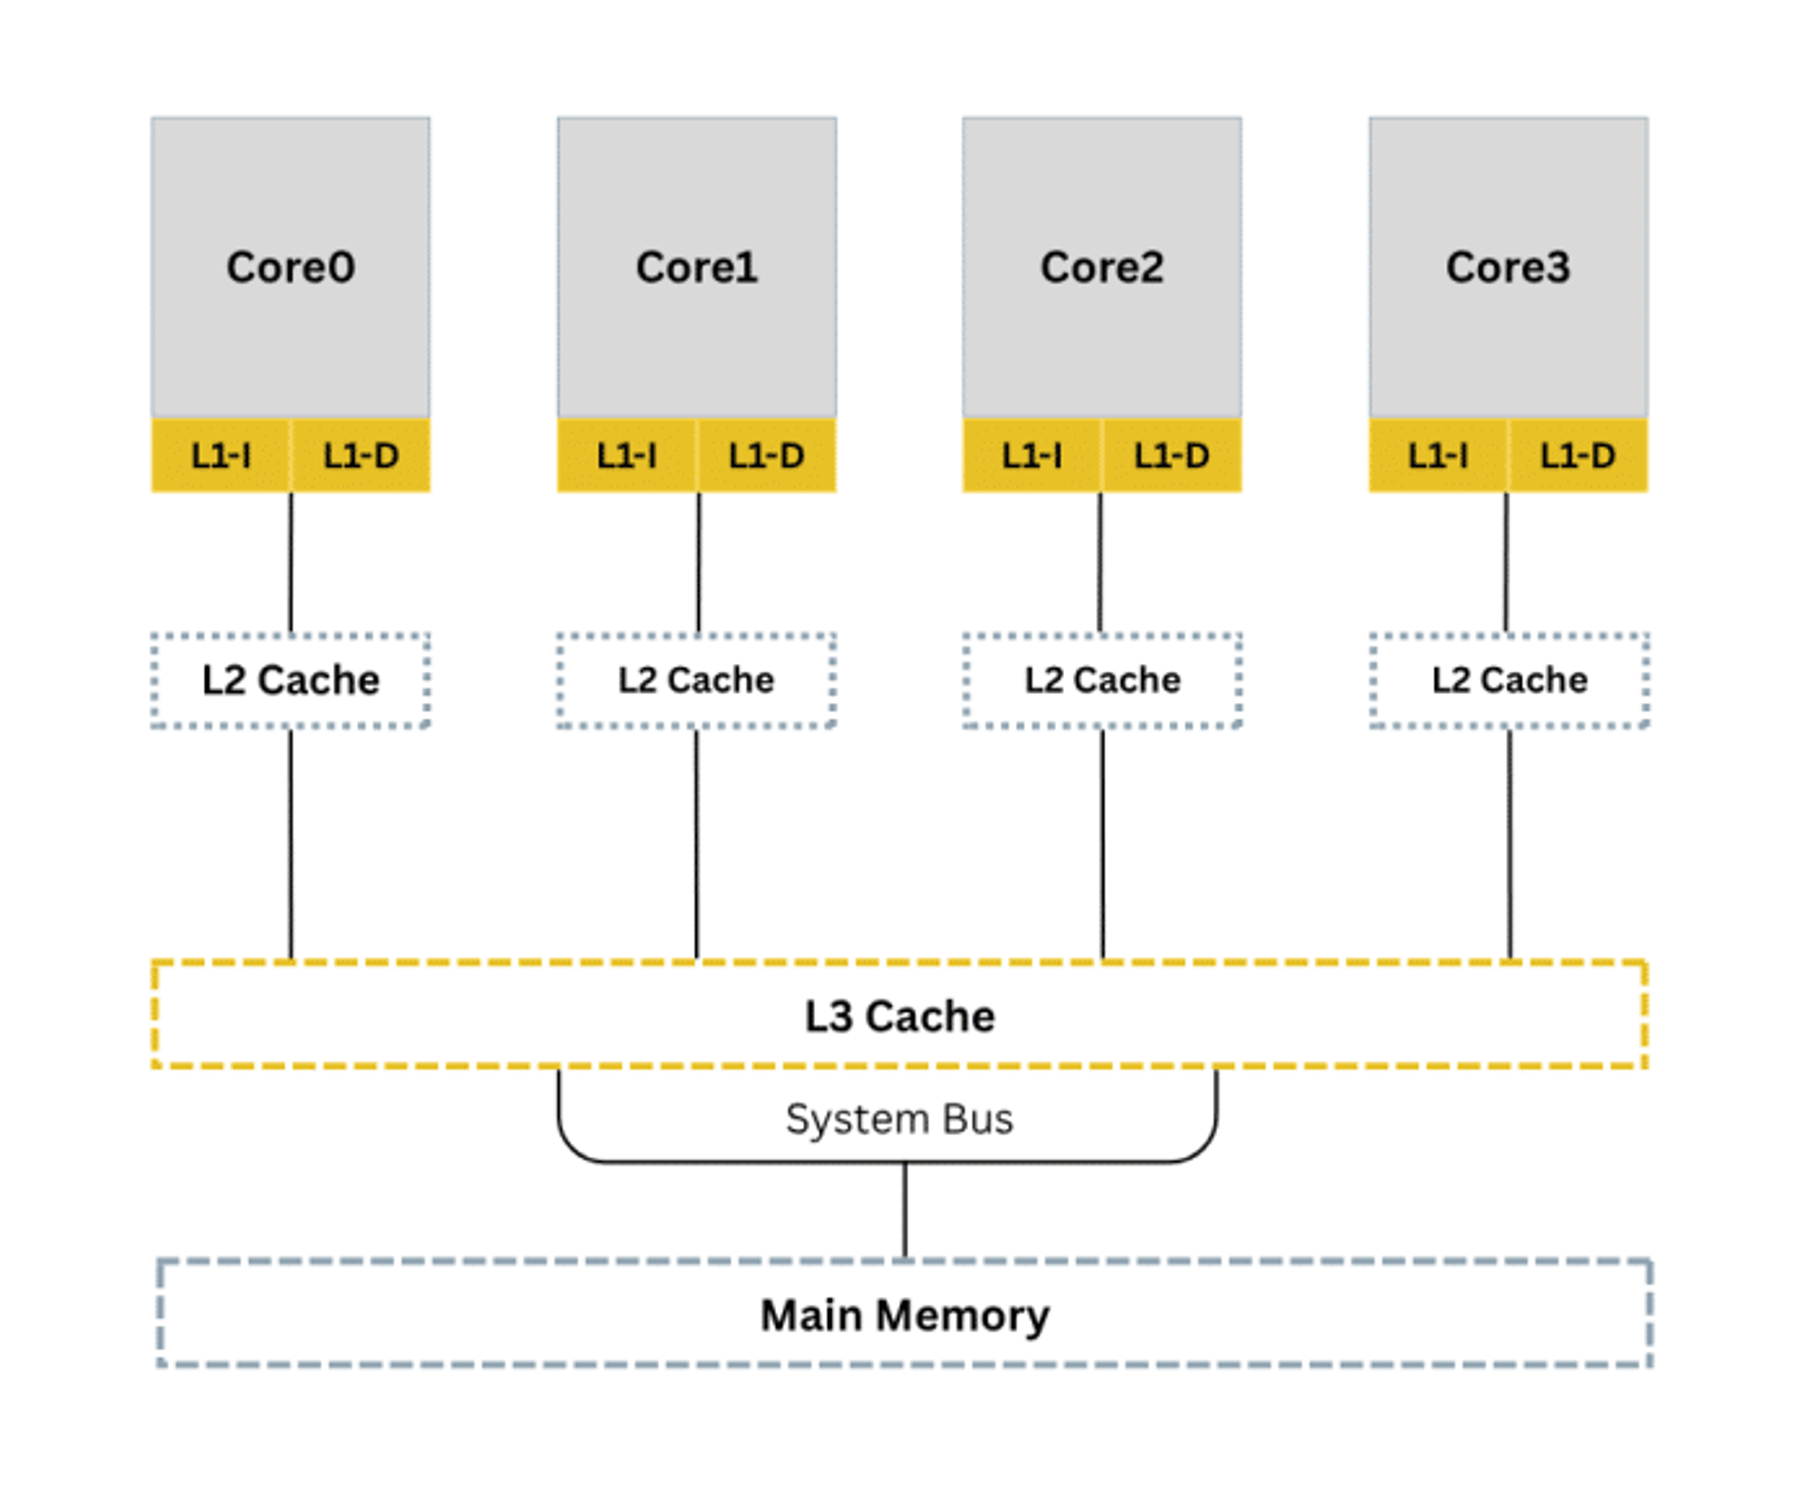
As developers, we choose which level to use based on the specific needs of our data.
L1 is the fastest but smallest, while L3 is largest and shared across multiple cores.
For this blog, we will focus on a dual-core system as we present ideas on how to trace and handle cache coherency problems when each core holds its own cache.
"This series is a conceptual guide for engineers entering multicore Zephyr development. The goal is to make you aware of where the hard problems live before you run into them in production and to show you which tools exist to address them when you do."
Detecting cache coherency problems
Cache coherency problems occur when several cores each have their own copy of the same data and access it at the wrong time. If one copy is changed, others may still use stale data, causing unpredictable behavior. Traditional debuggers show only main memory, not stale cached values.
Debugging with printf() can sometimes create “Heisenbugs,” where observing the system changes its timing.
Below is an animation showing how values on two cores diverge when cache is not handled:
Video Player
00:00
00:18
Overcoming cache coherency issues on Zephyr RTOS systems with SystemView with Ozone support
As shown in part 1, we must add instrumentation using SystemView to log system events. Initialize SystemView before adding event macros in key sections.
Enable debugging features in Zephyr
As a starting point, let’s configure Zephyr for multi-core debugging and tracing:
CONFIG_MP_MAX_NUM_CPUS=2CONFIG_DEBUG=yCONFIG_DEBUG_THREAD_INFO=yCONFIG_TRACING=yCONFIG_SEGGER_SYSTEMVIEW=yCONFIG_USE_SEGGER_RTT=yEnable the cache-related macro:
CONFIG_CACHE_MANAGEMENT=yEnabling this config means the kernel will handle cache coherency in AMP systems. If missing, use the tips below.
Instrument the code for tracing
When two cores access the same variable without ordering guarantees, the result is unpredictable. This is a shared data consistency problem not a hardware cache coherency issue, which would require both cores to have caches. On the RT1170, only the Cortex-M7 has an L1 data cache while the Cortex-M4 does not. What we face here is a software-level race condition on shared memory, solved through atomic operations and memory barriers.
SystemView provides SEGGER_SYSVIEW_PrintfHost() for tracing without blocking the target unlike printf(), it writes through RTT and does not stall execution. The snippets below use this to observe shared data before and after each increment.
Attempt 1: Inconsistent shared data
Core 0:
#define STACKSIZE 1024#define PRIORITY 7 void core0_thread(void *p1, void *p2, void *p3){ while (1) { shared_data++; /* Not atomic — race condition */ #if defined(CONFIG_SEGGER_SYSTEMVIEW) SEGGER_SYSVIEW_PrintfHost("Core0: shared_data = %d", shared_data);#endif k_msleep(10); }} K_THREAD_DEFINE(core0_id, STACKSIZE, core0_thread, NULL, NULL, NULL, PRIORITY, 0, 0);Core 1:
#define STACKSIZE 1024#define PRIORITY 7 void core1_thread(void *p1, void *p2, void *p3){ while (1) { shared_data++; /* Not atomic — race condition */ #if defined(CONFIG_SEGGER_SYSTEMVIEW) SEGGER_SYSVIEW_PrintfHost("Core1: shared_data = %d", shared_data);#endif k_msleep(10); }} K_THREAD_DEFINE(core1_id, STACKSIZE, core1_thread, NULL, NULL, NULL, PRIORITY, 0, 0);shared_data shall be declared as a global in a shared header and referenced as extern in each core's file so both cores access the same memory location.
Attempt 2: Consistent shared data
Core 0:
#define STACKSIZE 1024#define PRIORITY 7 atomic_t shared_data = ATOMIC_INIT(0x5); void core0_thread(void *p1, void *p2, void *p3){ while (1) {#if defined(CONFIG_SEGGER_SYSTEMVIEW) SEGGER_SYSVIEW_PrintfHost("Core0: Pre-Increment: %d", atomic_get(&shared_data));#endif atomic_inc(&shared_data); #if defined(CONFIG_SEGGER_SYSTEMVIEW) SEGGER_SYSVIEW_PrintfHost("Core0: Post-Increment: %d", atomic_get(&shared_data));#endif k_msleep(10); }} K_THREAD_DEFINE(core0_id, STACKSIZE, core0_thread, NULL, NULL, NULL, PRIORITY, 0, 0);Core 1:
#define STACKSIZE 1024#define PRIORITY 7 void core1_thread(void *p1, void *p2, void *p3){ while (1) {#if defined(CONFIG_SEGGER_SYSTEMVIEW) SEGGER_SYSVIEW_PrintfHost("Core1: Pre-Increment: %d", atomic_get(&shared_data));#endif atomic_inc(&shared_data); #if defined(CONFIG_SEGGER_SYSTEMVIEW) SEGGER_SYSVIEW_PrintfHost("Core1: Post-Increment: %d", atomic_get(&shared_data));#endif k_msleep(10); }} K_THREAD_DEFINE(core1_id, STACKSIZE, core1_thread, NULL, NULL, NULL, PRIORITY, 0, 0);Spinlock
static atomic_t lock = ATOMIC_INIT(0); while (!atomic_cas(&lock, 0, 1)) { } shared_counter++; atomic_clear(&lock);Zephyr provides k_spin_lock() / k_spin_unlock() which handle this correctly and also manage IRQ state. Prefer those over a manual spinlock in production code.
Ensuring Memory Ordering: DMB
__DMB() is shown here for awareness .On bare-metal ARM code or custom RTOS implementations that don't guarantee memory barriers in atomic operations, you would need this explicitly. In Zephyr, atomic_inc() already includes a full memory barrier, so the __DMB() is redundant but harmless.
void core1_thread(void *p1, void *p2, void *p3){ while (1) {#if defined(CONFIG_SEGGER_SYSTEMVIEW) SEGGER_SYSVIEW_PrintfHost("Core1: Pre-Increment: %d", atomic_get(&shared_data));#endif atomic_inc(&shared_data); __DMB(); /* Ensure write is visible to Core0 * before execution continues */ #if defined(CONFIG_SEGGER_SYSTEMVIEW) SEGGER_SYSVIEW_PrintfHost("Core1: Post-Increment: %d", atomic_get(&shared_data));#endif k_msleep(10); }}Debugging workflow tips
- Step 1: Use SystemView to detect race conditions.
- Step 2: Use Ozone to inspect memory, registers, cache control, and coherency.
Zephyr cache APIs
Zephyr provides cache maintenance APIs including cache_data_flush_range() and cache_data_invd_range(). These are meaningful only on cores that have a data cache .On Cortex-M series, that includes the M7, M55, and M85. The Cortex-M4 has no data cache, so these calls are no-ops on that core.
On a platform like the i.MX RT1170 (M7 + M4), only the M7 side needs to call these APIs. The M7 flushes its cache after writing to shared memory, and the M4 can then read the updated value directly from main memory without stale data.he.
Up next: Inter-core messaging
In the next part of this series, we’ll discuss inter-core messaging.